
Single-Family Home Prices Show Slight Softening
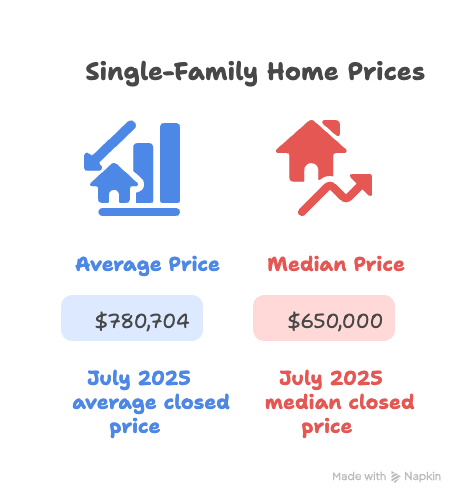
The average closed price for single-family homes in the Greater Metro Denver area for July 2025 settled at $780,704. This marks a slight month-over-month dip of 3.6%, and a year-over-year decrease of 0.6%. Similarly, the median closed price landed at $650,000, down 1.5% from June and 0.8% compared to July 2024. Despite these modest decreases, average pricing remains above pre-2023 levels, reflecting long-term stability in the region.
Condo and Townhome Market Experiences Price Pullback
The condo and townhome segment saw more pronounced movement. The average closed price dropped to $421,218, representing a 4.1% decline from the previous month and a 7.3% year-over-year slide. Median prices came in at $389,500, down 2.6% from June and 5.5% annually. These adjustments signal cooling in the entry-level segment, which may create opportunities for first-time buyers and investors.
Price Per Square Foot Trends Downward
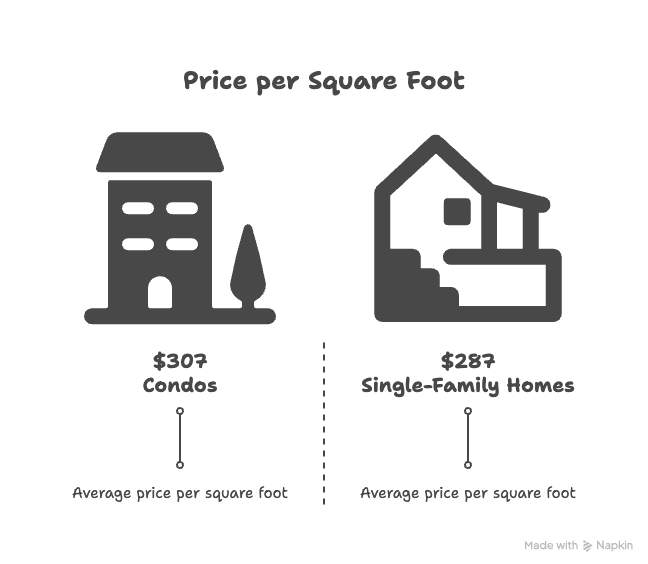
Price-per-square-foot metrics show a modest contraction across both property types. Single-family homes averaged $287 per square foot, down 2.4% month-over-month and 1.0% year-over-year. Condos averaged a higher $307 per square foot but still registered a 1.6% decline from June and a 5.5% decrease annually. These shifts suggest greater buyer leverage and an evolving pricing environment.
Inventory Levels Rise, But New Listings Lag
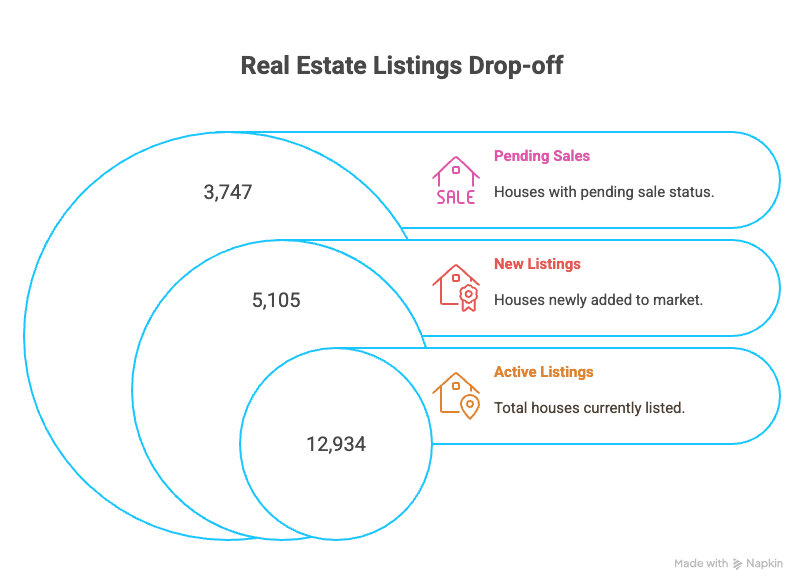
Active listings in the metro area reached 12,934 in July 2025, reflecting a 27.0% year-over-year increase. However, new listings fell to 5,105 for the month, an 8.0% decline from June but a slight 5.4% rise from last July. The growing active inventory combined with declining new listings points to slower seller activity and longer market durations.
Buyer Demand Holds Steady
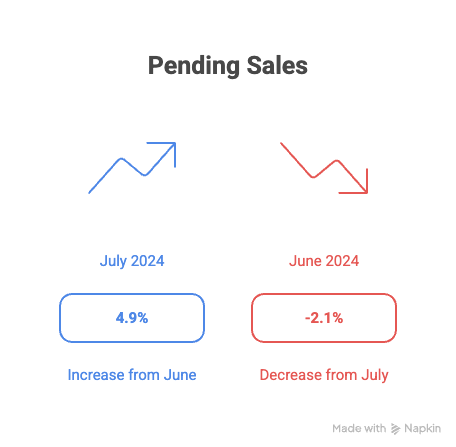
Pending sales totaled 3,747 in July, a small 2.1% decrease from June but up 4.9% compared to July 2024. The months supply of inventory ticked down slightly to 3.70 from 3.90 last month, though it remains well above last year’s 3.10 level, signaling a more balanced market.
Market Activity Slows
Homes spent an average of 40 days on the MLS before going under contract in July—an 11.1% increase from the prior month and a 33.3% jump year-over-year. Meanwhile, the percent of closed price to list price edged down to 98.8%, compared to 99.1% in both June and July 2024. These figures suggest sellers are adjusting expectations while buyers negotiate more assertively.
Showing Activity Indicates Cautious Optimism
The average number of showings per listing climbed to 4.6 in July, a 4.5% monthly increase, though still 9.8% lower than a year ago. Average showings per pending transaction rose to 14.1, up 5.2% from June and 6.0% from July 2024. Buyers are taking more time and viewing more properties before committing, highlighting a thoughtful approach to purchase decisions.
 What This Means for Buyers and Sellers
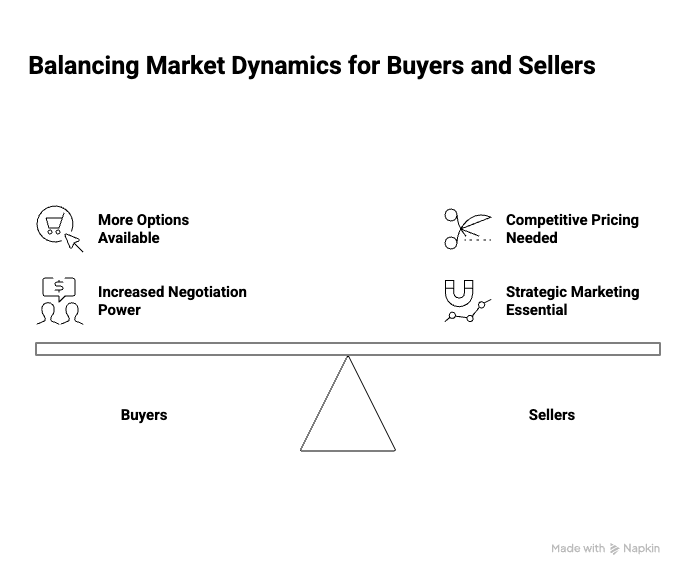
While prices in most segments show minor cooling, inventory is up and days on market are longer, offering buyers more options and negotiation power. For sellers, competitive pricing and strategic marketing will be essential to attract interest. The market is balancing out, signaling a return to healthier, more sustainable dynamics.
Whether you're buying, selling, or investing, Corken + Company offers trusted guidance and deep market insight across Greater Metro Denver. Visit www.corken.co or call 303-858-8003 to learn how we can support your real estate goals.
Key Market Stats from July 2025
-
Average Closed Price (Single Family): $780,704
-
Median Closed Price (Single Family): $650,000
-
Average Closed Price (Condo/Townhome): $421,218
-
Median Closed Price (Condo/Townhome): $389,500
-
Price Per Sq Ft (Single Family): $287
-
Price Per Sq Ft (Condo/Townhome): $307
-
Active Listings: 12,934
-
New Listings: 5,105
-
Pending Sales: 3,747
-
Months Supply: 3.70
-
Avg Days on Market: 40
-
% of Closed Price to List Price: 98.8%
-
Showings per Listing: 4.6
-
Showings per Pending Sale: 14.1


